A. Population Projections and Source
TNRCC is requesting that the 1998 Plan Update Form include a baseline population of 1996 in order for all the COGs to report consistent data to aid TNRCC in updating statewide data. In addition, TNRCC requests that all COGs use the August 1997 updates from the Texas State Data Center for July 1, 1996. The July 1, 1996 interim update for the fourteen counties in the ETCOG region is 704,621. This baseline 1996 population count and the methodology is listed under section "B Baseline Population of 1996 and Methodology" on page 19.
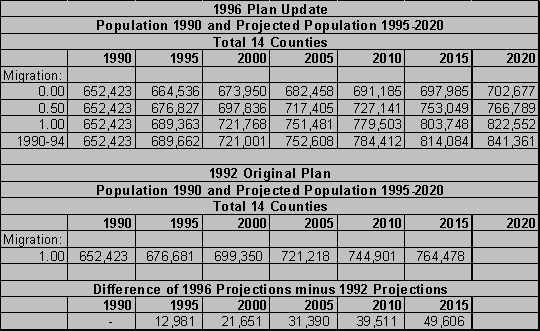
Listed below are the February 1996 population projections provided by the same Texas State Data Center, which are updated figures in comparison to the 1990 projections included in the plan. The 1990-94 migration pattern from the February 1996 projections is compared with the 1.00 migration patterns from the 1991 plan. The 1990-94 migration uses projections based on actual migration patterns that occurred during 1990-94, 1.00 migration uses projections based on actual migrations during the decade of the 1980s. The 1.00 is used because that is the only migration pattern included in the 1991 plan—the 1980s being the most aggressive increase up to that time. The 1990-94 migration is used from the February 1996 data because it is similar to the most recent July 1, 1996 baseline update, and because it also is the most aggressive regarding increases in population over the long term. This will provide a more conservative outlook in associating population growth with landfill capacity. That is, it would be better to ensure capacity for the higher population figures rather than low instead of risking a shortage in capacity.
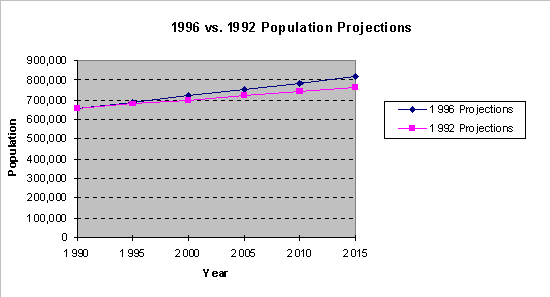
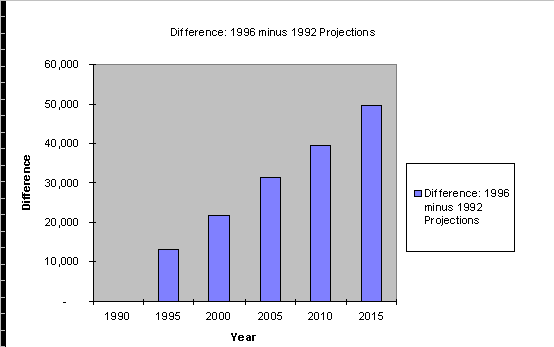
Therefore, as reflected in Chart III.A.2 and Chart III.A.3, the population growth is updated to reflect greater growth than was forecasted in the 1991 plan. A result can be made that in the year 2005, the ETCOG population could reach 752,608 instead of 721,218, a difference of 31,390. Therefore, capacity in year 2005 would need to facilitate this difference in population. That equals between 24 and 29 more tons capacity needed for the year 2005. See section "D Waste Disposal Rates" for discussion on capacity which considers this updated population projection information.

Table III.A.1

Chart III.A1

Chart III.A.2
Source: "Projections of the Population of Texas and Counties in Texas by Age, Sex and Race/Ethnicity for 1990-2030" by Population Estimates and Projections Program, Texas State Data Center, Department of Rural Sociology, Texas Agricultural Experiment Station, Texas A&M University System and The Center for Demographic and Socioeconomic Research and Education, Department of Rural Sociology, Texas Agricultural Experiment Station, Texas A&M University System, February 1996.
B. Baseline Population of 1996 and Methodology
TNRCC requests that all COGs use 1996 as the baseline year for matching population to 1996 solid waste disposal rates, disposal capacity, and waste flow. In addition, TNRCC requests that all COGs use the August 1997 updates from the Texas State Data Center for July 1, 1996. The findings for this interim update and methodology are listed below.
Texas State Data Center July 1, 1996 Population Update
The July 1, 1996 interim update for the fourteen counties in the ETCOG region is 704,621.
If you have any questions concerning these estimates, please contact:
Dr. Steve H. Murdock, Chief Demographer
Texas State Data Center
Department of Rural Sociology
Texas A&M University
College Station, Texas 77843-2125
(409) 845-5115